
The oil desk data banks pay for, in one terminal.
Real tanker traffic and official inventory prints — insider data translated into a clear WTI read before New York opens: bullish, bearish, or stand aside.
Email or Google · Encrypted access · Cancel anytime
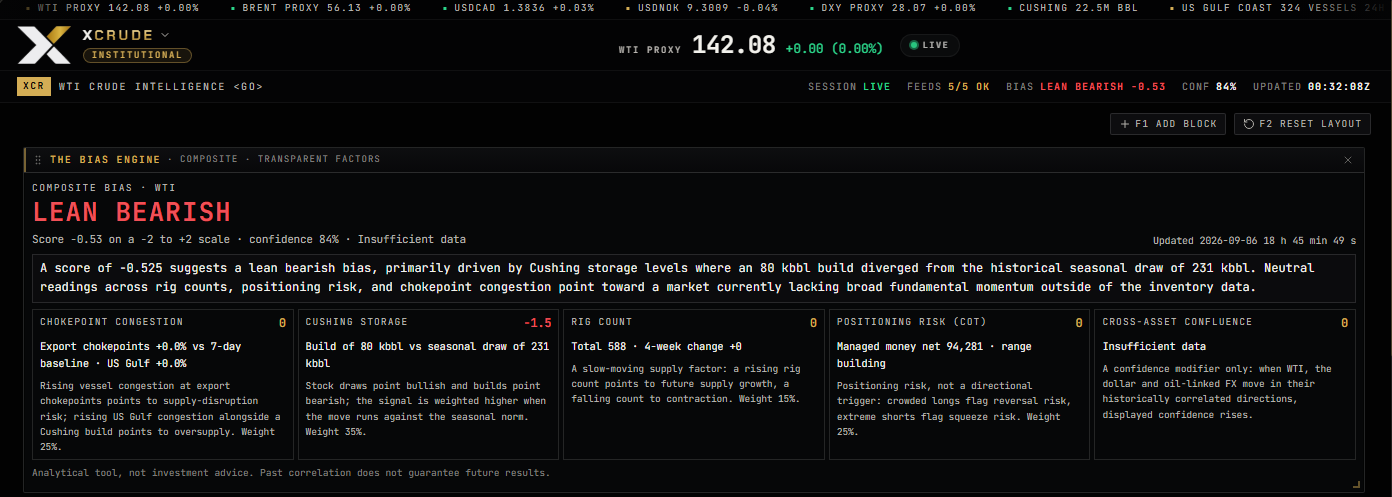
Six data engines. One directional read.
Retail traders watch price. Professionals watch the physical market underneath it. Xcrude puts that second layer on your screen.
Live vessel counts across Hormuz, Suez, Malacca, Bab el-Mandeb and the US Gulf on a real traffic map, scored against the 7-day baseline. Congestion building = supply not moving = bullish. Verified source data.
Official weekly storage stocks at the WTI delivery point: week/week change, 52-week percentile and the move vs the 5-year seasonal average — the gap professionals actually trade.
A senior-desk read on what is moving crude today, with directional outlooks at +4h, +24h and +48h. Fed by the live data underneath it — not generic news summaries.
Every input — storage, congestion, rigs, positioning — weighted into one transparent composite score from -2 to +2. You see each factor's contribution. No black box.
Hourly confluence: what the dollar, CAD, NOK and Brent did in the last 1h/4h/24h, and what that pressure implies for WTI right now — built for day traders.
Weekly rig counts for future supply, and managed-money positioning to spot crowded longs and squeeze risk before the move, not after.
Watch the barrels before they arrive
A live traffic map of the five straits the crude market depends on. Every triangle is a tracked vessel. When the count climbs above its baseline and ships sit idle, supply is stuck at sea — and that reads bullish for WTI long before it shows up on the tape.
- Hormuz · Malacca · Suez · Bab el-Mandeb · US Gulf
- Idle vs underway split, refreshed hourly
- Plain-English read under every zone
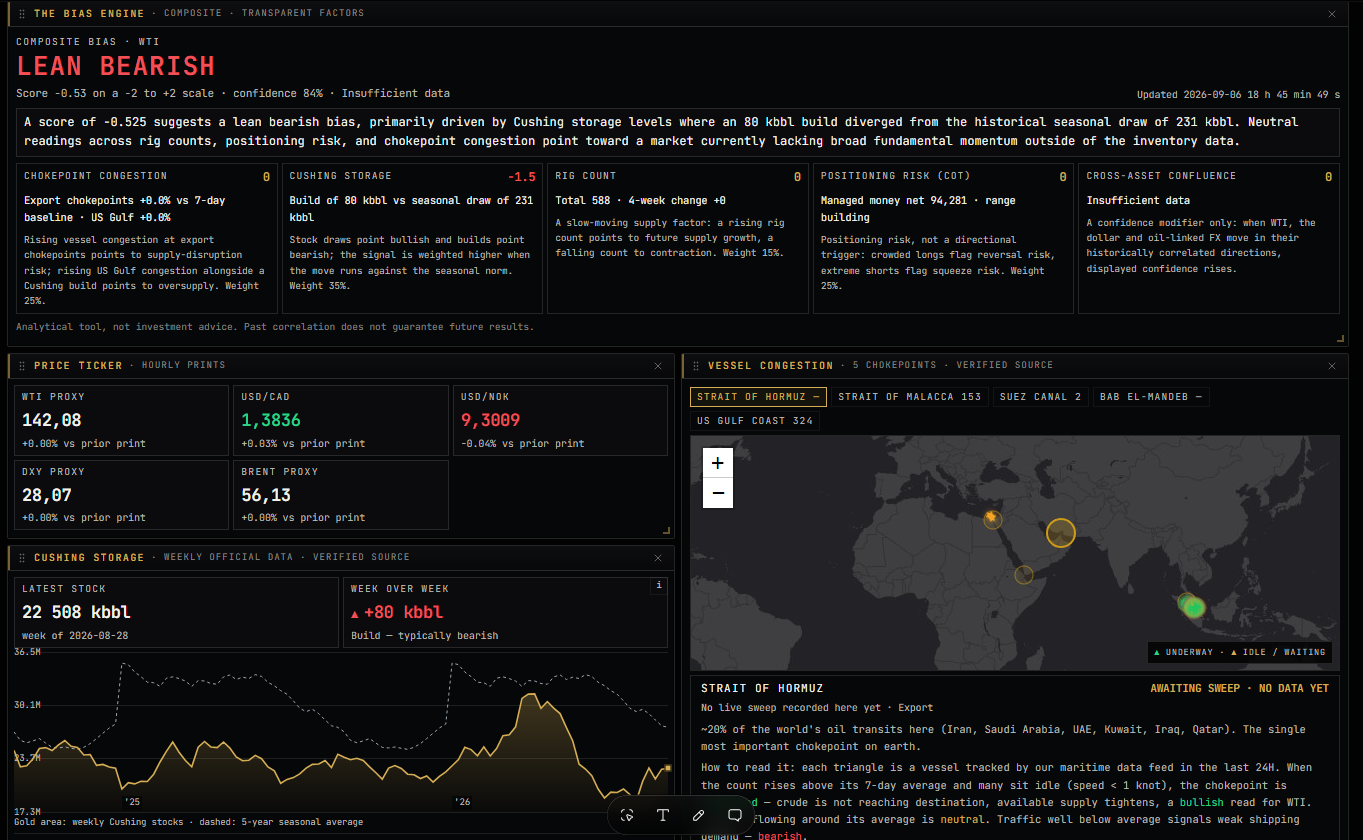
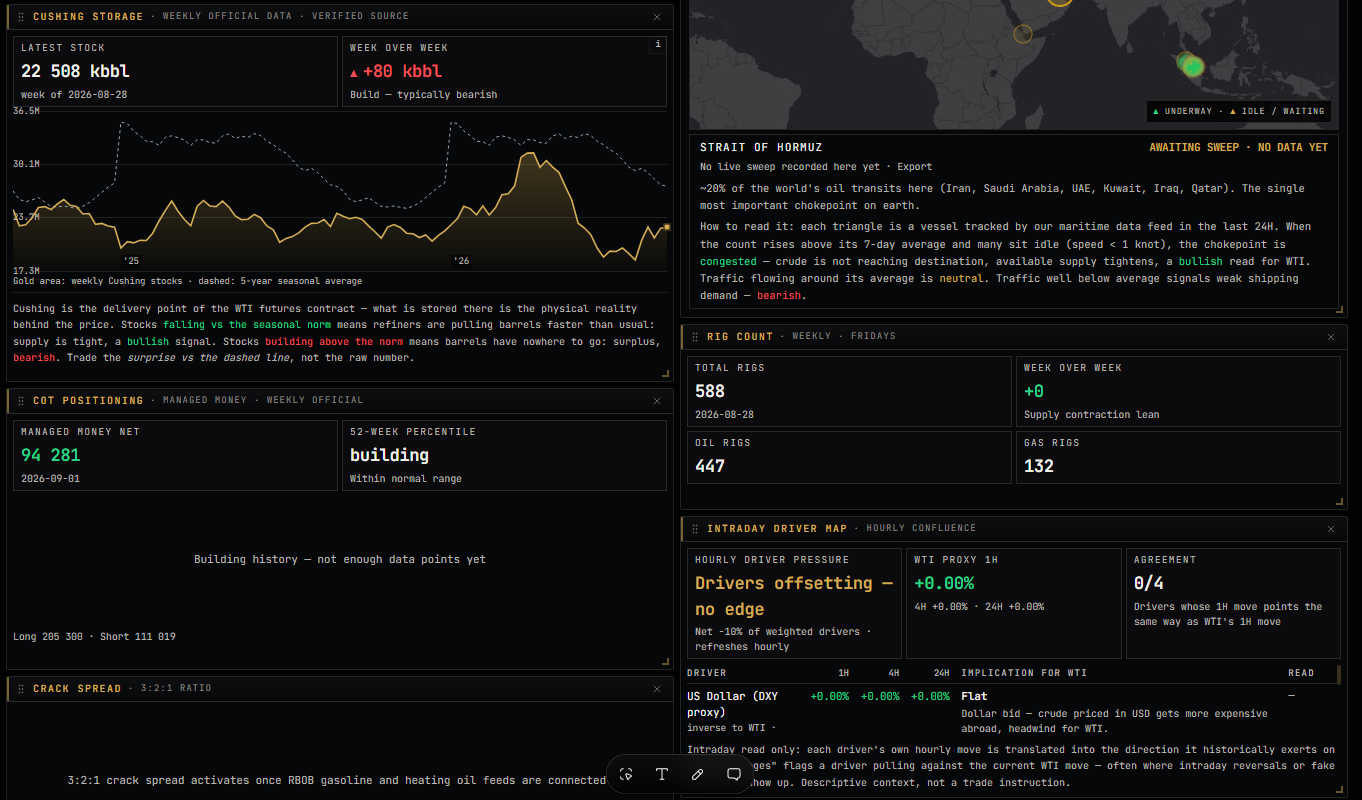
Every block explains itself
Storage stocks against a real multi-year seasonal line, managed-money positioning, rig counts and an hourly driver map for the dollar, CAD, NOK and Brent. Drag any block where you want it — your layout is saved to your account.
Get accessFrom the water to your screen
Tankers slow in a strait. Stocks draw at Cushing. Rigs shut down. Funds crowd one side. Raw physical and positioning events, collected around the clock from verified sources.
Each factor is scored against its own baseline — seasonal norms, 7-day averages, historical ranges — then combined into one directional bias with stated confidence.
Bullish, bearish, or stand aside — plus the confirmation to wait for and the level that invalidates the idea. You arrive before New York opens already knowing the plan.
Verified sources. Zero guesswork.
Every figure in the terminal traces back to an official statistic, a live maritime feed or an exchange report. We never estimate, never invent — when data is missing, the terminal says so instead of filling the gap.
See it liveOne plan. Everything included.
- Full terminal: all six data engines
- AI desk brief with +4h / +24h / +48h outlooks
- Live chokepoint traffic map
- Bias alerts the moment the score flips
- Custom layout, saved to your account
- Cancel anytime
Secure checkout · Instant activation
Before you ask
Is this a signal service?+
No. Xcrude is an intelligence terminal: it aggregates physical and positioning data, scores it transparently, and shows you the reasoning. The final decision — and the risk — is always yours. Nothing here is financial advice.
Where does the data come from?+
From verified official and commercial sources — government statistics, maritime traffic feeds and exchange positioning reports. We deliberately do not disclose our exact supply chain; every figure is marked as verified source data.
I trade intraday. Is this useful for me?+
Yes. The Intraday Driver Map refreshes hourly and the bias engine flags regime changes in real time. Weekly data (storage, rigs, positioning) sets the backdrop; intraday drivers time the entry.
Do I need to know how to read charts?+
No. The terminal is built around numbers and plain-English explanations. Every block tells you what changed, why it matters, and whether it leans bullish or bearish.
Can I cancel?+
Yes, anytime. Your access runs to the end of the paid quarter — no lock-in, no cancellation calls.